
How Sales Analytics Boost Menu Performance
In the competitive restaurant industry, intuition and experience alone are no longer sufficient to optimize menu performance. The difference between a good menu and a great one—one that maximizes profitability while satisfying customers—often comes down to data. Sales analytics transform raw numbers from your POS software for restaurants into actionable intelligence, providing a clear roadmap for strategic menu decisions. By understanding what sells, what profits, and why customers choose certain items, restaurants can engineer menus that consistently drive higher average ticket value and improved overall performance.
Beyond simply tracking daily revenue, advanced menu analytics delve into the patterns behind the numbers. They reveal which items are your true profit drivers, which promotions actually work, and how customer behavior changes with time, season, or menu layout. For restaurant owners committed to grow restaurant business online and offline, leveraging sales data is not an option—it's a fundamental requirement for sustainable growth and operational excellence.
Key Menu Metrics Every Restaurant Should Track
Effective menu analysis starts with identifying and monitoring the right key performance indicators (KPIs).
1. Item Popularity (Sales Volume)
Understanding what customers are ordering is the foundation of menu analysis.
- Units Sold: The raw number of times each menu item is ordered during a specific period.
- Menu Mix Percentage: The percentage of total sales each item represents, showing its relative popularity.
- Sales Trends: How an item's popularity changes over time, by day part, or by season.
- Category Performance: How entire menu categories (appetizers, entrees, desserts) perform relative to each other.
2. Profitability Metrics
Popularity doesn't always equal profitability—these metrics reveal the true financial picture.
- Gross Profit per Item: The selling price minus the food cost for each item.
- Contribution Margin: How much each item contributes to overall profit after covering its direct costs.
- Food Cost Percentage: The ratio of ingredient cost to selling price for each item.
- Profitability Trends: How an item's profitability changes as ingredient costs fluctuate.
3. Customer Behavior Indicators
These metrics reveal how customers interact with your menu and make choices.
- Modification Rate: How often items are customized, indicating potential issues or opportunities.
- Pairing Patterns: Which items are frequently ordered together, suggesting natural bundling opportunities.
- Price Sensitivity: How sales volume changes when prices are adjusted.
- New Item Adoption: How quickly customers embrace new menu additions.
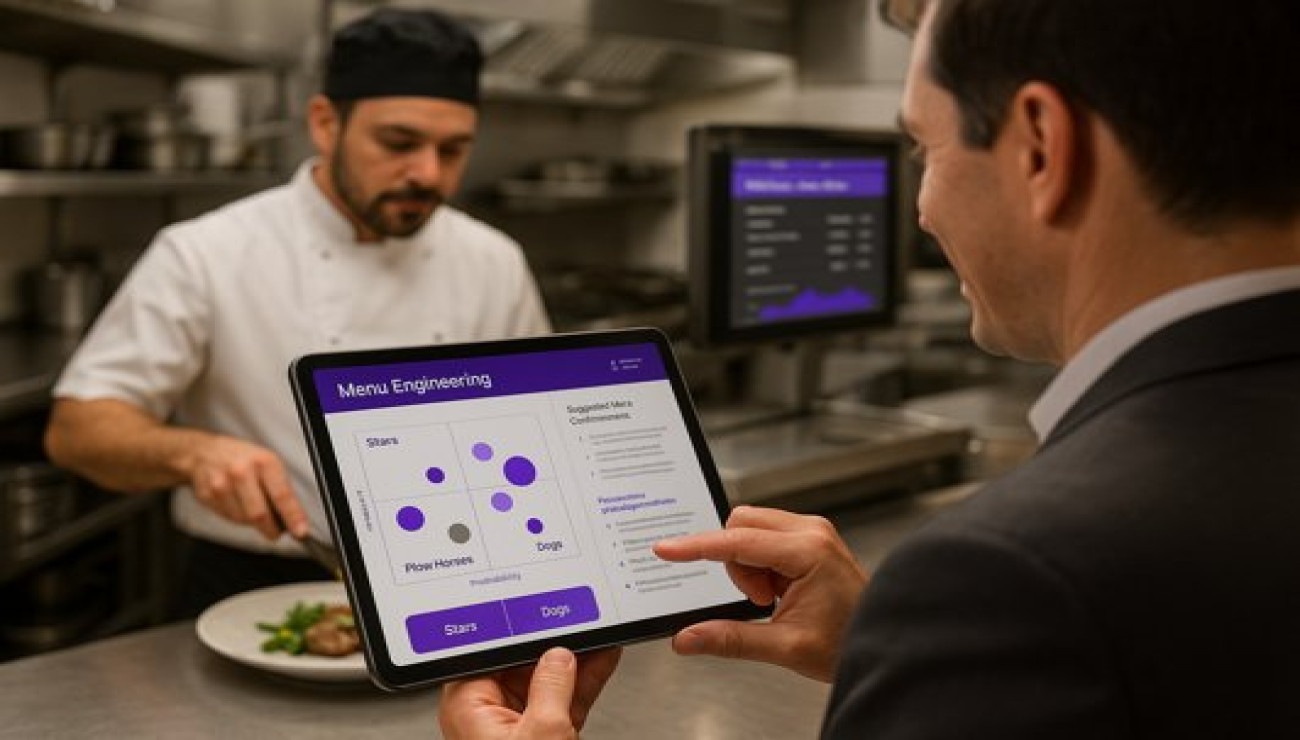
The Menu Engineering Matrix: A Framework for Action
The most powerful analytical tool for menu optimization is the menu engineering matrix, which categorizes every item based on its popularity and profitability.
1. Stars: High Profitability, High Popularity
These items are both customer favorites and profit drivers—your menu's champions.
- Action: Promote them heavily through placement, descriptions, and server recommendations. Ensure consistent availability and quality.
- Strategic Consideration: Consider slight price increases if demand remains strong, but be cautious not to undermine value perception.
2. Plow Horses: High Popularity, Low Profitability
These items are customer favorites but contribute little to your bottom line.
- Action: Improve profitability through strategic price increases, portion adjustments, or cost reduction without compromising quality. Bundle with high-margin items.
- Strategic Consideration: Some plow horses may be necessary loss leaders that drive traffic and complementary purchases.
3. Puzzles: High Profitability, Low Popularity
These items have strong margins but aren't selling well—often due to lack of awareness or ineffective promotion.
- Action: Market aggressively through menu placement, descriptive language, and staff training. Consider limited-time offers to generate trial.
- Strategic Consideration: Some puzzles may need recipe refinement or better presentation if they're not appealing despite promotion.
4. Dogs: Low Profitability, Low Popularity
These items drain resources without contributing significantly to sales or profit.
- Action: Remove from the menu to simplify operations and focus on more profitable items.
- Strategic Consideration: Some dogs may serve a specific niche or dietary need that justifies their retention despite poor performance.
Leveraging Analytics for Strategic Menu Decisions
Beyond categorization, sales data should inform specific menu engineering tactics.
1. Strategic Placement and Layout Optimization
Data reveals how menu layout influences ordering behavior.
- Eye-Tracking Patterns: Use sales data to infer where customers' eyes travel on your menu (physical or digital).
- Prime Real Estate Allocation: Place high-profit items in areas that naturally attract attention.
- Digital Menu Advantages: A/B test different layouts on your QR code food menu to determine optimal arrangement.
- Category Sequencing: Structure menu sections to guide customers toward profitable choices.
2. Dynamic Pricing Strategies
Data-driven pricing moves beyond cost-plus models to value-based strategies.
- Price Elasticity Testing: Measure how price changes affect demand for specific items.
- Daypart Pricing: Adjust prices based on demand patterns throughout the day.
- Bundle Pricing: Create combos based on pairing data that increase perceived value and average ticket value.
- Competitive Positioning: Use data to position prices relative to competitors while maintaining margin targets.
3. Menu Item Development and Retirement
Analytics should guide both introduction and removal of menu items.
- New Item Performance Tracking: Monitor trial rates, repeat orders, and overall adoption of new offerings.
- Ingredient Utilization Analysis: Identify opportunities for new dishes that utilize underutilized ingredients.
- Seasonal Optimization: Use historical data to plan seasonal menus that align with ingredient availability and customer preferences.
- Failure Analysis: Understand why certain items underperform to avoid similar mistakes in the future.
A Case Study: Data-Driven Menu Transformation
A casual dining restaurant was struggling with stagnant sales and declining profitability. They implemented a comprehensive menu analytics program using their POS software for restaurants to track key metrics across all menu items.
Findings: Their best-selling burger (25% of entree sales) was a "Plow Horse" with a 38% food cost. Meanwhile, a seafood dish with a 22% food cost was a "Puzzle"—highly profitable but representing only 4% of sales. They also identified three "Dog" appetizers that collectively occupied 15% of menu space but contributed only 3% of revenue.
Actions Taken: They slightly reformulated the popular burger to reduce food cost to 32% without compromising quality. They made the seafood dish a "Chef's Recommendation" with enhanced description and staff training. They removed the underperforming appetizers and introduced a new appetizer using ingredients from the removed items.
Results after three months:
- Overall food cost decreased from 34% to 30%
- Sales of the seafood dish increased from 4% to 12% of entree sales
- Average ticket value increased by 9%
- Customer satisfaction scores improved due to more focused menu and better staff recommendations
Menu Analytics Implementation Checklist
- Ensure Data Accuracy: Verify that your POS system accurately tracks all sales and properly categorizes menu items.
- Establish Baseline Metrics: Capture current performance data before making changes to measure impact.
- Categorize Menu Items: Classify all items into Stars, Plow Horses, Puzzles, and Dogs using sales and cost data.
- Analyze Customer Behavior: Study modification patterns, pairing trends, and price sensitivity.
- Develop Action Plans: Create specific strategies for each menu category based on its characteristics.
- Implement Changes Gradually: Make controlled adjustments to measure impact without overwhelming customers.
- Train Your Team: Ensure staff understands menu changes and can effectively recommend targeted items.
- Monitor and Adjust: Continuously track performance and be prepared to refine your approach.
Integrating Menu Analytics with Brostrategy
Menu analytics shouldn't exist in isolation—they should inform and be informed by other business functions.
1. Inventory Management Integration
Connect menu performance data with inventory systems to optimize purchasing and reduce waste.
2. Marketing Alignment
Use menu analytics to inform promotional strategies and digital marketing efforts.
3. Staff Performance Management
Correlate menu performance with server data to identify training opportunities.
Conclusion: From Guesswork to Precision
The era of designing menus based on intuition and anecdotal feedback is ending. Restaurants that embrace sales analytics gain a significant competitive advantage through data-driven decision making. By understanding not just what customers order but why they make those choices, restaurants can create menus that simultaneously maximize satisfaction and profitability. The most successful menus of the future will be those engineered with precision, tested with rigor, and refined continuously based on solid data rather than guesswork.
Transform your menu from a static price list into a dynamic profit engine driven by data and customer insights.


Comments (0)